


By Ryan Maue, Florida State University, COAPS on Climate Audit
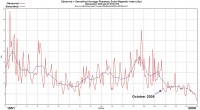
Global hurricane activity has decreased to the lowest level in 30 years.
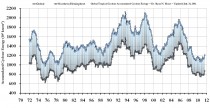
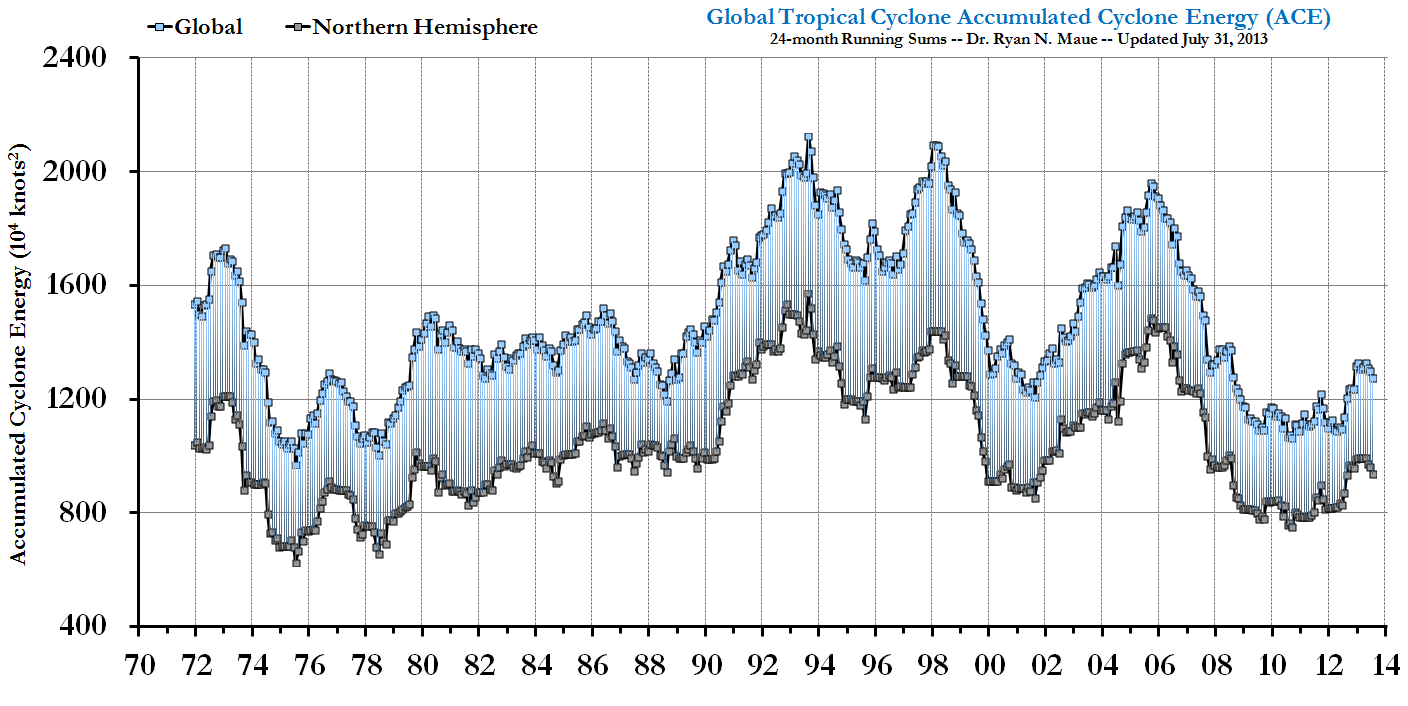
Global 24-month running sum time-series of Accumulated Cyclone Energy updated through March 12, 2009. See larger image here.
Very important: global hurricane activity includes the 80-90 tropical cyclones that develop around the world during a given calendar year, including the 12-15 that occur in the North Atlantic (Gulf of Mexico and Caribbean included). The heightened activity in the North Atlantic since 1995 is included in the data used to create this figure.
As previously reported here and here at Climate Audit, and chronicled at my Florida State Global Hurricane Update page, both Northern Hemisphere and overall Global hurricane activity has continued to sink to levels not seen since the 1970s. Even more astounding, when the Southern Hemisphere hurricane data is analyzed to create a global value, we see that Global Hurricane Energy has sunk to 30-year lows, at the least. Since hurricane intensity and detection data is problematic as one goes back in time, when reporting and observing practices were different than today, it is possible that we underestimated global hurricane energy during the 1970s.
Using a well-accepted metric called the Accumulated Cyclone Energy index or ACE for short (Bell and Chelliah 2006), which has been used by Klotzbach (2006) and Emanuel (2005) (PDI is analogous to ACE), and most recently by myself in Maue (2009), simple analysis shows that 24-month running sums of global ACE or hurricane energy have plummeted to levels not seen in 30 years. Why use 24-month running sums instead of simply yearly values? Since a primary driver of the Earth’s climate from year to year is the El Nino Southern Oscillation (ENSO) acts on time scales on the order of 2-7 years, and the fact that the bulk of the Southern Hemisphere hurricane season occurs from October - March, a reasonable interpretation of global hurricane activity requires a better metric than simply calendar year totals. The 24-month running sums is analogous to the idea of “what have you done for me lately”.
During the past 6 months, extending back to October of 2008 when the Southern Hemisphere tropical season was gearing up, global ACE had crashed due to two consecutive years of well-below average Northern Hemisphere hurricane activity. To avoid confusion, I am not specifically addressing the North Atlantic, which was above normal in 2008 (in terms of ACE), but the hemisphere (and or globe) as a whole. The North Atlantic only represents a 1/10 to 1/8 of global hurricane energy output on average but deservedly so demands disproportionate media attention due to the devastating societal impacts of recent major hurricane landfalls.
Why the record low ACE? During the past 2 years +, the Earth’s climate has cooled under the effects of a dramatic La Nina episode. The Pacific Ocean basin typically sees much weaker hurricanes that indeed have shorter lifecycles and therefore - less ACE . Conversely, due to well-researched upper-atmospheric flow (e.g. vertical shear) configurations favorable to Atlantic hurricane development and intensification, La Nina falls tend to favor very active seasons in the Atlantic (word of warning for 2009). This offsetting relationship, high in the Atlantic and low in the Pacific, is a topic of discussion in my GRL paper, which will be a separate topic in a future posting. Thus, the Western North Pacific (typhoons) tropical activity was well below normal in 2007 and 2008 (see table). Same for the Eastern North Pacific. The Southern Hemisphere, which includes the southern Indian Ocean from the coast of Mozambique across Madagascar to the coast of Australia, into the South Pacific and Coral Sea, saw below normal activity as well in 2008. Through March 12, 2009, the Southern Hemisphere ACE is about half of what’s expected in a normal year, with a multitude of very weak, short-lived hurricanes. All of these numbers tell a very simple story: just as there are active periods of hurricane activity around the globe, there are inactive periods, and we are currently experiencing one of the most impressive inactive periods, now for almost 3 years.
Bottom Line: Under global warming scenarios, hurricane intensity is expected to increase (on the order of a few percent), but MANY questions remain as to how much, where, and when. This science is very far from settled. Indeed, Al Gore has dropped the related slide in his PowerPoint (btw, is he addicted to the Teleprompter as well?) Many papers have suggested that these changes are already occurring especially in the strongest of hurricanes, e.g. this and that and here, due to warming sea-surface temperatures (the methodology and data issues with each of these papers has been discussed here at CA, and will be even more in the coming months). The notion that the overall global hurricane energy or ACE has collapsed does not contradict the above papers but provides an additional, perhaps less publicized piece of the puzzle. Indeed, the very strong interannual variability of global hurricane ACE (energy) highly correlated to ENSO, suggests that the role of tropical cyclones in climate is modulated very strongly by the big movers and shakers in large-scale, global climate. The perceptible (and perhaps measurable) impact of global warming on hurricanes in today’s climate is arguably a pittance compared to the reorganization and modulation of hurricane formation locations and preferred tracks/intensification corridors dominated by ENSO (and other natural climate factors). Moreover, our understanding of the complicated role of hurricanes with and role in climate is nebulous to be charitable. We must increase our understanding of the current climate’s hurricane activity. Read more here.
By Alan Caruba, Warning Signs
Warning! Avoid the April edition of U.S. News & World Report because it is devoted to the question, “Can America Prosper in the New Green Economy?”
See larger cartoon here.
What is wrong with this? For one thing, we are not in a “new Green economy” and, if the folks at U.S. News
had taken time to notice, we are closing in on having no economy thanks to the stupidity of several Congresses and the deliberate effort to repeat all the errors of the successive Franklin D. Roosevelt administrations that prolonged the Great Depression for ten long years.
There is no great plethora of new Green jobs unless, perhaps, you are referring to the minimum wage jobs that involve picking up dead birds slaughtered by the wind turbines in the States that were foolish enough to think they might actually generate electricity on a scale that one good nuclear or coal-fired plant could. They can’t. They never will. They exist only because of government subsidies and the increased energy bills for consumers.
What offends me most (aside from the fact that I actually subscribed to this pathetic, knee-jerk, liberal excuse for “news") is the way this news magazine and all of the mainstream media repeatedly fail to get the message about all things Green. It’s a SCAM.
After decades of claims that have been repeatedly debunked, these alleged news magazines are still propagating the same old Green lies. Newsweek and Time have tried to outdo one another with the scariest covers about a global warming catastrophe that never happened and never will. So, why should we expect U.S. News to step up to the plate with anything other than the same tired Green message?
The editor, Brian Kelly, revealed the real bias of the issue. What’s changed, in a word, is Obama. The president and the tide of voters who swept him into office want a change in the way we manage energy and the environment - and to put them at the top of the country’s agenda. It looks like that will happen.”
Earth to Brian! Humans do not manage the environment! We are not in charge of the Sun, the oceans, the clouds, the volcanoes, the blizzards, the tornadoes, et cetera.
Moreover, Obama did not get elected with a huge mandate or tide of voters. The vote was separated by five percentage points, a relatively small margin. The only mandate Obama has is the one in his fevered, socialist mind.
Read more here.
Guest post by David Archibald with intro by Anthony Watts on Watts Up With That
Quick primer:
Beryllium-10 is an isotope that is a proxy for the sun’s activity. Be10 is produced in the atmosphere by cosmic ray collisions with atoms of oxygen and nitrogen. Beryllium 10 concentrations are linked to cosmic ray intensity which can be a proxy for solar strength.
One way to capture earth’s record of that proxy data is to drill deep ice cores. Greenland, due to having a large and relatively stable deep ice sheet is often the target for drilling ice cores. Isotopic analysis of the ice in the core can be linked to temperature and global sea level variations. Analysis of the air contained in bubbles in the ice can reveal the palaeocomposition of the atmosphere, in particular CO2 variations. Volcanic eruptions leave identifiable ash layers.
While it sounds simple to analyze, there are issues of ice compression, flow, and other factors that must be taken into consideration when doing reconstructions from such data. I attended a talk at ICCC 09 that showed one of the ice core operations had procedures that left significant contamination issues for CO2. But since Beryllium is rather rare, it doesn’t seem to have the same contamination issues attached. - Anthony
Guest post by David Archibald
A couple of years ago on Climate Audit, I undertook to do battle with Dr Svalgaard’s invariate Sun using Dye 3 Be10 data. And so it has come to pass. Plotted up and annotated, the Dye 3 data shows the strong relationship between solar activity and climate. Instead of wading through hundreds of papers for evidence of the Sun’s influence on terrestrial climate, all you have to do is look at this graph.
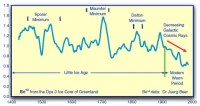
See larger image here
All the major climate minima are evident in the Be10 record, and the cold period at the end of the 19th century. This graph alone demonstrates that the warming of the 20th century was solar-driven.
The end of the Little Ice Age corresponded with a dramatic decrease in the rate of production of Be10, due to fewer galactic cosmic rays getting into the inner planets of the solar system. Fewer galactic cosmic rays got into the inner planets because the solar wind got stronger. The solar wind got stronger because the Sun’s magnetic field got stronger, as measured by the aa Index from 1868.
Thus the recent fall of aa Index and Ap Index to lows never seen before in living memory is of considerable interest.
See larger image here.
This reminds me of a line out of Aliens: “Stay frosty people!” Well, we won’t have any choice - it will get frosty. See full post and comments here.
By Alister Doyle, Environment Correspondent
U.S. President Barack Obama should seek an alliance with China and Europe to tax greenhouse gas emissions and abandon his plans for carbon trading, a leading U.S. scientist said on Monday. James Hansen, director of NASA’s Goddard Institute for Space Studies, said the U.N.’s Kyoto Protocol had exposed flaws in a cap-and-trade plan favoured by Obama for fighting climate change.
An international tax of perhaps $1 per gallon (3.8 litres) of gasoline, he said, was simpler and better. “We need stronger measures in terms of a price signal on fossil fuels,” he said during a visit to Norway. Two decades ago, Hansen alerted the U.S. Congress to risks of global warming such as floods, droughts and rising sea levels.
“My suggestion is that if Europe, the United States and China would agree on a carbon price, and the carbon price has to be significant ... that would be enough of a signal to make a change in lifestyles,” he told a news conference. He said China, which has overtaken the United States as top greenhouse emitter according to many experts, should also embrace a tax to help curb pollution and help diversify its economy away from fossil fuels blamed for stoking warming.
“They have every reason, the same as the United States and Europe, to want to move to a more energy efficient economy,” he told Reuters. China and other developing nations say rich nations must do most to cut emissions because poor nations need to use more energy to grow their economies. U.S. emissions per capita are about four times those of China.
The United States would raise an average of $3,000 per person per year in taxes under Hansen’s suggested $1 tax per gallon of gasoline that would serve as a benchmark for taxing fossil fuel emissions throughout the economy. The receipts would be repaid equally to all adults—children would get a half share. Anyone cutting back and emitting less than the national average would make money since the $3,000 income would exceed their personal tax payments.
Obama favours a cap-and-trade market, along the lines of the EU’s market which sets caps for big emitters, such as coal-fired power plants, cement makers or oil refineries. In such a market, industry has to hold a credit for every tonne emitted. If they overshoot their quota they have to buy extra permits and can sell if they undershoot. Backers say such markets are more efficient because they put pressure on the big polluters to clean up.
“The key is to spur the technology revolution we need,” Norwegian Environment Minister Erik Solheim, who backs a cap-and-trade system, told a news conference with Hansen. Hansen said countries inside the tax system could impose an import duty on products bought from outsiders. In 1988, Hansen testified before a Senate committee that “the greenhouse effect has been detected, and it is changing our climate now.” Read more now. See the Climate Realist site coverage of this with a Facebook page link on the page here.
Given that CO2 is not a pollutant but a plant fertilizer and is not an important climate change factor, neither a cap-and-trade (really a tax-and-trade) nor a carbon tax is needed. Indeed we should welcome increased CO2 as a benefit, a boon to agriculture.
By Lorne Gunter, National Post
William Happer is hardly a climate change “denier.” A physics professor at Princeton, he is a former director of energy research for the U. S. Department of Energy, where he supervised work on climate change between 1990 and 1993. He is also one of the world’s leading experts on “the interactions of visible and infrared radiation with gases,” and on carbon dioxide and the greenhouse effect. Two weeks ago, he told the U. S. Congress, “I believe the increase of CO2 (in the atmosphere) is not a cause for alarm.”
Claims that an increase of atmospheric CO2 will lead to catastrophic warming “are wildly exaggerated,” according to Prof. Happer. While a doubling (we have seen about a 35% rise since the beginning of the Industrial Revolution) might lead to a 0.6C rise in global temperature, he told Congress, “additional increments of CO2 will cause relatively less direct warming because we already have so much CO2 ... that it has blocked most of the infrared radiation that it can.”
Prof. Happer added that while CO2 concentrations have risen steadily for more than 100 years, warming began before that—200 years ago—and even during the time when temperatures and carbon concentrations have risen together, the link has hardly been consistent. For instance, while CO2 was rising rapidly from 1950 to 1970, temperatures were going through an especially cold period. Over the past decade, while carbon dioxide concentrations have continued to grow, there has been “a slight cooling,” according to the Princeton physicist. Any warming in recent decades, then, “seems to be due mostly to natural causes, not to increasing levels of carbon dioxide.”
Why then do organizations such as the UN’s Intergovernmental Panel on Climate Change (IPCC) continue to put faith in climate supercomputer models that show disastrous warming in the coming century? Because, as Prof. Happer explained, the IPCC believes in what is called a “positive feedback loop.” In short, water vapour and clouds account for about 98% of the greenhouse effect versus less than 2% for CO2. The IPCC believes, though, that a doubling of CO2, while not significant on its own, will trigger a huge increase in the greenhouse impact of water vapour. But so far, in the realworld, “the feedback is close to zero and may even be negative.” Prof. Happer testified. The significance of Prof. Happer’s statement is not that it proves global warming is false, but rather that it shows there is no consensus among respected scientists. The notion that the “science is settled,” as claimed by global warming advocates, is not true.
Also, two weeks ago, three of five independent scientists asked by Japan’s Society of Energy and Resources to assess the current state of climate science concluded that global warming, to the extent it is still occurring, is a natural phenomenon, not manmade. In his official contribution, Kanya Kusano, program director at the Earth Simulator at the Japan Agency for Marine-Earth Science and Technology, called the IPCC’s warming theories “an unprovable hypothesis” and likened the current supercomputer models to ancient astrology.
Even the Discovery Channel, never a fan of scientists who dissent from climate orthodoxy, reported last week on a University of Wisconsin study that shows global temperatures have at least flatlined during the past decade and that that trend could continue for another 30 years. The authors of that report—Kyle Swanson and Anastasios Tsonis—think rapid warming could resume after that. But for now, warming has ceased.
Against this legitimate scientific doubt, recent statements by environmentalists and alarmist scientists sounds positively hysterical. Robert Kennedy, Jr. called coal companies “criminal enterprises” and demanded their CEOs be jailed “for all eternity.” Michael Tobis, a climate modeller at the University of Texas labelled as “palpably evil” anyone who questioned the wisdom of former U. S. vice-president Al Gore and suggested that doubting Mr. Gore was “morally comparable to killing 1,000 people.” U. S. Energy Secretary Stephen Chu claimed warming will lead to “no more agriculture in California.” Meanwhile Susan Solomon, of the U. S. National Oceanic and Atmospheric Administration and lead scientist with the IPCC, said even if carbon emissions are stopped, temperatures around the globe will remain high until at least the year 3000 and within 10 years “the oceans will be toxic, and all life in them will die.”
Ironic, isn’t it, that those who doubt the warming theories are the ones called the “deniers.” Read more here.
By Joseph D’Aleo on Intellicast
The sun continues in hibernation mode. NASA and others thought in late 2006 it had bottomed out but it has continued to slide. Since it can’t go negative, it has leveled off scraping the bottom of the chart. The NASA team projections for the next cycle continue to slip further into the future and periodically adjusted down. They present two scenarios one for a more active cycle (24) with a peak at the start of 2012 and the second a weaker one peaking around the end of 2012 or start of 2013.
See larger here.
When will the minimum be? Since the most common method is the 13 month running mean. You don’t know for sure when a minimum takes place sometimes until 6 months after it occurs. The exception would be a month with a very big jump (Much higher than 13 months ago). That would indicate the mean 7 months ago will turn up, at least a relative minimum. With the February sunspot number lower than 13 months ago, the minimum can’t be earlier than August 2008 and more likely October 2008. It could be later. That would make the cycle 23 length at least 12 years 5 months long. That would be the longest since the middle 1800s and perhaps the late 1700s or early 1800s.
See larger here.
There are many scientists who believe cycle 24 will be far less active than either NASA projection. Some use cycle length and the behavior of certain types of activity like the geomagnetic activity at the minimum as indicators. Like the climate and ENSO forecast models, some models are statistical others dynamical. See some projections here.
They include Clilverd et al who believes based on regression analysis a very quiet cycle like the early 1800s. He states:
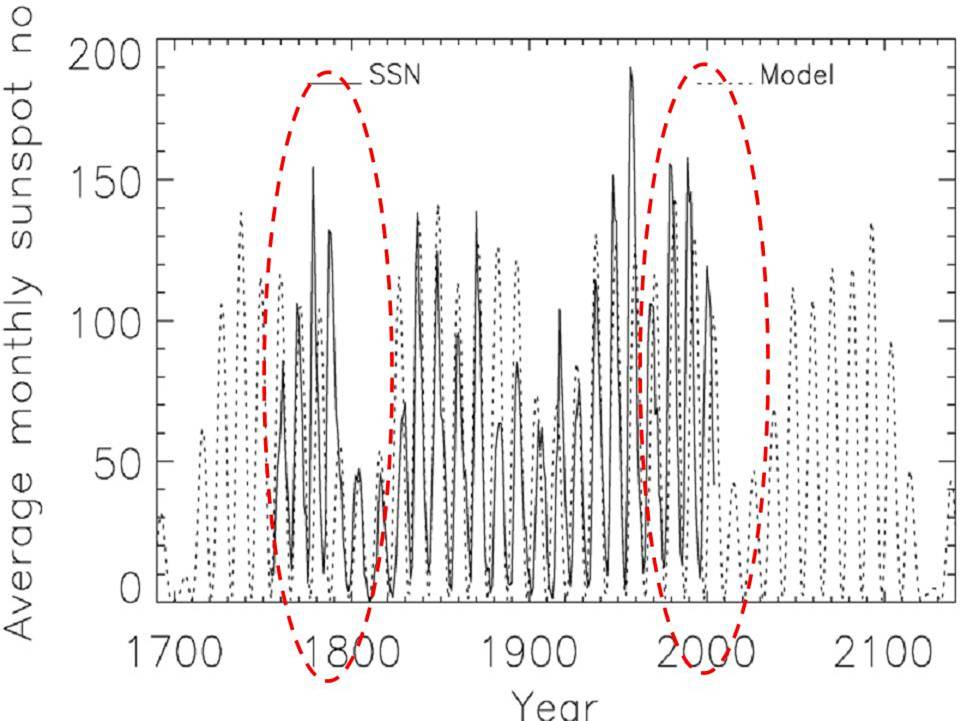
“We use a model for sunspot number using low-frequency solar oscillations, with periods 22, 53, 88, 106, 213, and 420 years modulating the 11-year Schwabe cycle, to predict the peak sunspot number of cycle 24 and for future cycles, including the period around 2100 A.D. We extend the earlier work of Damon and Jirikowic (1992) by adding a further long-period component of 420 years.
Typically, the standard deviation between the model and the peak sunspot number in each solar cycle from 1750 to 1970 is plus or minus 34. The peak sunspot prediction for cycles 21, 22, and 23 agree with the observed sunspot activity levels within the error estimate. Our peak sunspot prediction for cycle 24 is significantly smaller than cycle 23, with peak sunspot numbers predicted to be 42 plus or minus 34.”
See larger here.
The Geomagnetic Index (Ap) also continues extraordinarily low. This has resulted in a very low level of aurora activity. As this Newsminer story noted:"The Interior’s normal wintertime light show has been noticeably absent this winter.”

See much more here.
The Scientific Alliance Newsletter, March 13, 2009
The concept of original sin is alive and well and being nurtured by the green movement. Climate change (meaning the manmade variety) is the latest in a long line of impending disasters for which our species is being blamed. It seems more than coincidental that the rise of environmentalism has been at a time when there has been a big drop in religious adherence; the guilt which was felt by previous generations for their imperfection and general unworthiness has now been transferred to our species’ impact on Nature (or Gaia, for those who want to make it more personal).
From DDT to GM crops, nuclear power to Brent Spar, there have always been one or more campaigns which the activists have focussed on, generally with great success. But the crucial difference between these issues and climate change is that this time mainstream scientists are allies and, in turn, the political class has been brought on board. It has also seen the evolution of the scientist as activist, a hybrid which has never before wielded such influence. We might expect that, given such a broad coalition, the pressure for action would be irresistible and, indeed, this seems to be true. Until now.
Just as the change in party in the White House appeared to have removed a major obstacle to concerted international action on climate change mitigation policy, so the global economic crisis (also with its roots in America) threatens to scupper these hopes. The hundreds of billions of dollars, euros and pounds which would be needed to roll out more renewable power and fund Chinese and Indian low carbon development just will not be available at a time when everything is being done to avoid a prolonged global depression. Politicians may not like to admit this, but the truth is unavoidable.
To compound this, we have now had a decade with no rise in average temperatures and, indeed, something which is beginning to look like a cooling trend. Supporters of the anthropogenic global warming hypothesis will point out -quite legitimately - that ten years is too short a time to assign a clear trend to, but it is equally valid to point out that there were only thirty years of warming prior to this, following the last significant shift in climate in the mid-1970s. Who will be willing to bet the bank on measures to avoid a continuing warming trend when there may be none?
The frustration of the environmentalist and mainstream scientific alliance can only be imagined. Just when the prize of a meaningful post-Kyoto mitigation agreement seemed to be within their grasp, it is visibly slipping away from them. For such a treaty to be meaningful, it has to include China and India, but they in turn hold all the high cards and have made it perfectly clear that the West has to provide the funds. Failing to meet your own targets (as many Kyoto-ratifying countries will surely do) is one thing, but to agree a post-2012 deal and then not be able to fund the commitments to developing countries would be inconceivable. Better not to reach an agreement this year, and that is exactly what many commentators expect.
But a failure or fudge at Copenhagen risks dissipating the momentum built up over a number of years, and there may not be another chance. Hence the increasingly extreme rhetoric from the activists. The latest examples include, for instance, an almost hysterical article in last weekend’s Sunday Times headlined “the toxic sea”, in which we are warned that the oceans are being turned into “acidified soups” and that we will have to mourn the “tiny marine organisms dissolving in acidified water”. The horror story suggests that ocean pH could go as low as 7.3 (from its current approximately 8.1) by 2300. In reality, this means going from very mildly alkaline to just on the alkaline side of neutral (pH 7). Acidified soup? I think not. Read more here.
A statement by Viv Forbes, Chairman of the Carbon Sense Coalition
The Carbon Sense Coalition today called on all parties in the looming state election to make a clear statement on their policies regarding Emissions Trading and Carbon Taxes. The Chairman of the Carbon Sense Coalition, Mr Viv Forbes, said that politicians in a state so overwhelmingly dependent on carbon energy, carbon food and taxes on carbon products can no longer hide behind hypothetical anti-carbon scare stories based on dubious climate forecasts for 100 years ahead.
“We have a real present emergency with growing fear among investors and shareholders in anything associated with mining, power generation, tourism and farming - the backbone industries of Queensland.” “Much of this fear is generated by an insane campaign to demonise carbon dioxide, the natural atmospheric gas on which all life depends.’
“There is growing scientific recognition that carbon dioxide does not control climate - rather the other way around - temperatures rise because of solar influences and those rising temperatures expel carbon dioxide from that great carbon storehouse - the oceans”. “There is also growing recognition that current levels of carbon dioxide in the atmosphere are very low and the gradual increases occurring at present pose no threat to any life on earth. The reverse is true - all life will benefit from more carbon dioxide in the atmosphere, and the benefits will be increased by the slight warming experienced over the last one hundred years.
“We are supposed to panic over carbon dioxide levels of a miniscule 380 parts per million. Most life, plants and animals, probably developed with CO2 levels of about 1500 ppm - 400% above current levels. This fact is well understood by greenhouse operators who burn gas to increase CO2 levels to at least 1,000 ppm, 260% above current atmospheric levels. Inside populated buildings, CO2 levels of 3,000 ppm (770% above current levels) have been measured in homes, schools and offices with no ill effects. Even most Health and Safety people consider 5,000 ppm (1,300% above current levels) to be safe. Medical gas given to people with respiratory problems typically contains 50,000 ppm CO2 (13,000% above current levels) and our lung sacs retain about 65,000 ppm (16,800 % above current levels). Not until CO2 levels get to 100,000 ppm (260 times current levels) is there any concern about human health.
“All plant life will also benefit from increased carbon dioxide, and much of the extra food produced by the green revolution is the result of the warmer and more carbon-rich atmosphere. It seems that those who are trying to demonise carbon dioxide have a death wish for Queensland society. To achieve significant cuts in carbon emissions from man’s activities would requires massive destruction of our energy, farming, smelting, cement, transport and tourism industries, together with the jobs and prosperity of the populations that depend on them. The war against carbon is a war against coal, cattle, concrete, cars, electricity and breathing - who thinks Queensland can survive without these?”
“It is time for the people of Queensland to be told which parties are supporting or condoning this reckless policy.” For more information on the importance of carbon dioxide to human health go here.